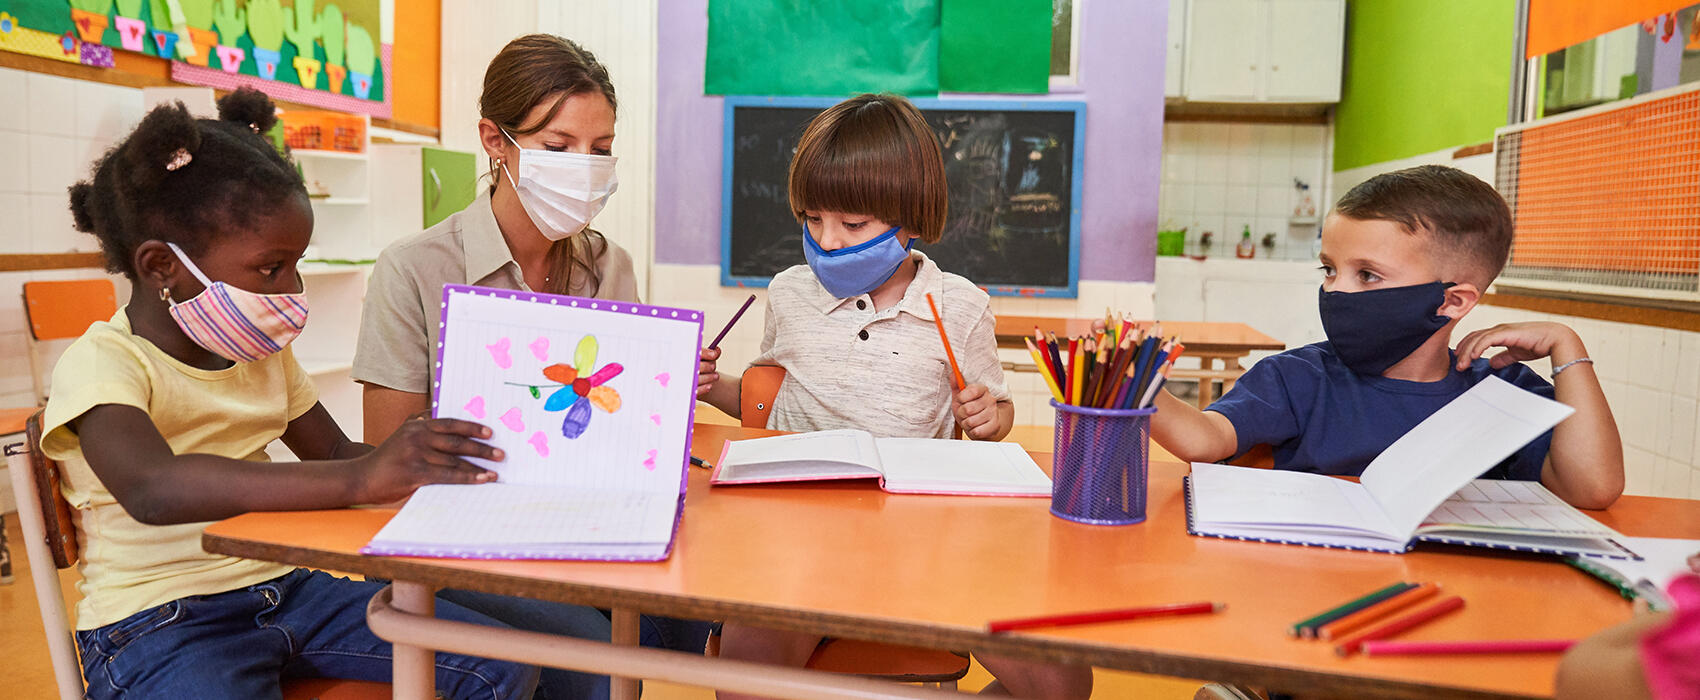
Public spending on children is an investment in the nation’s future, helping ensure the next generation grows up healthy, educated, and safe. During a national crisis, this funding is even more vital for children’s development.
In response to the pandemic, the federal government provided unprecedented new funding through multiple emergency relief bills. Those federal dollars, combined with assistance from some states, have reduced hardship for millions of children.
These six charts show how the nation’s response to the pandemic led to dramatic spending increases for children and improved the well-being of kids and their families—if only temporarily.
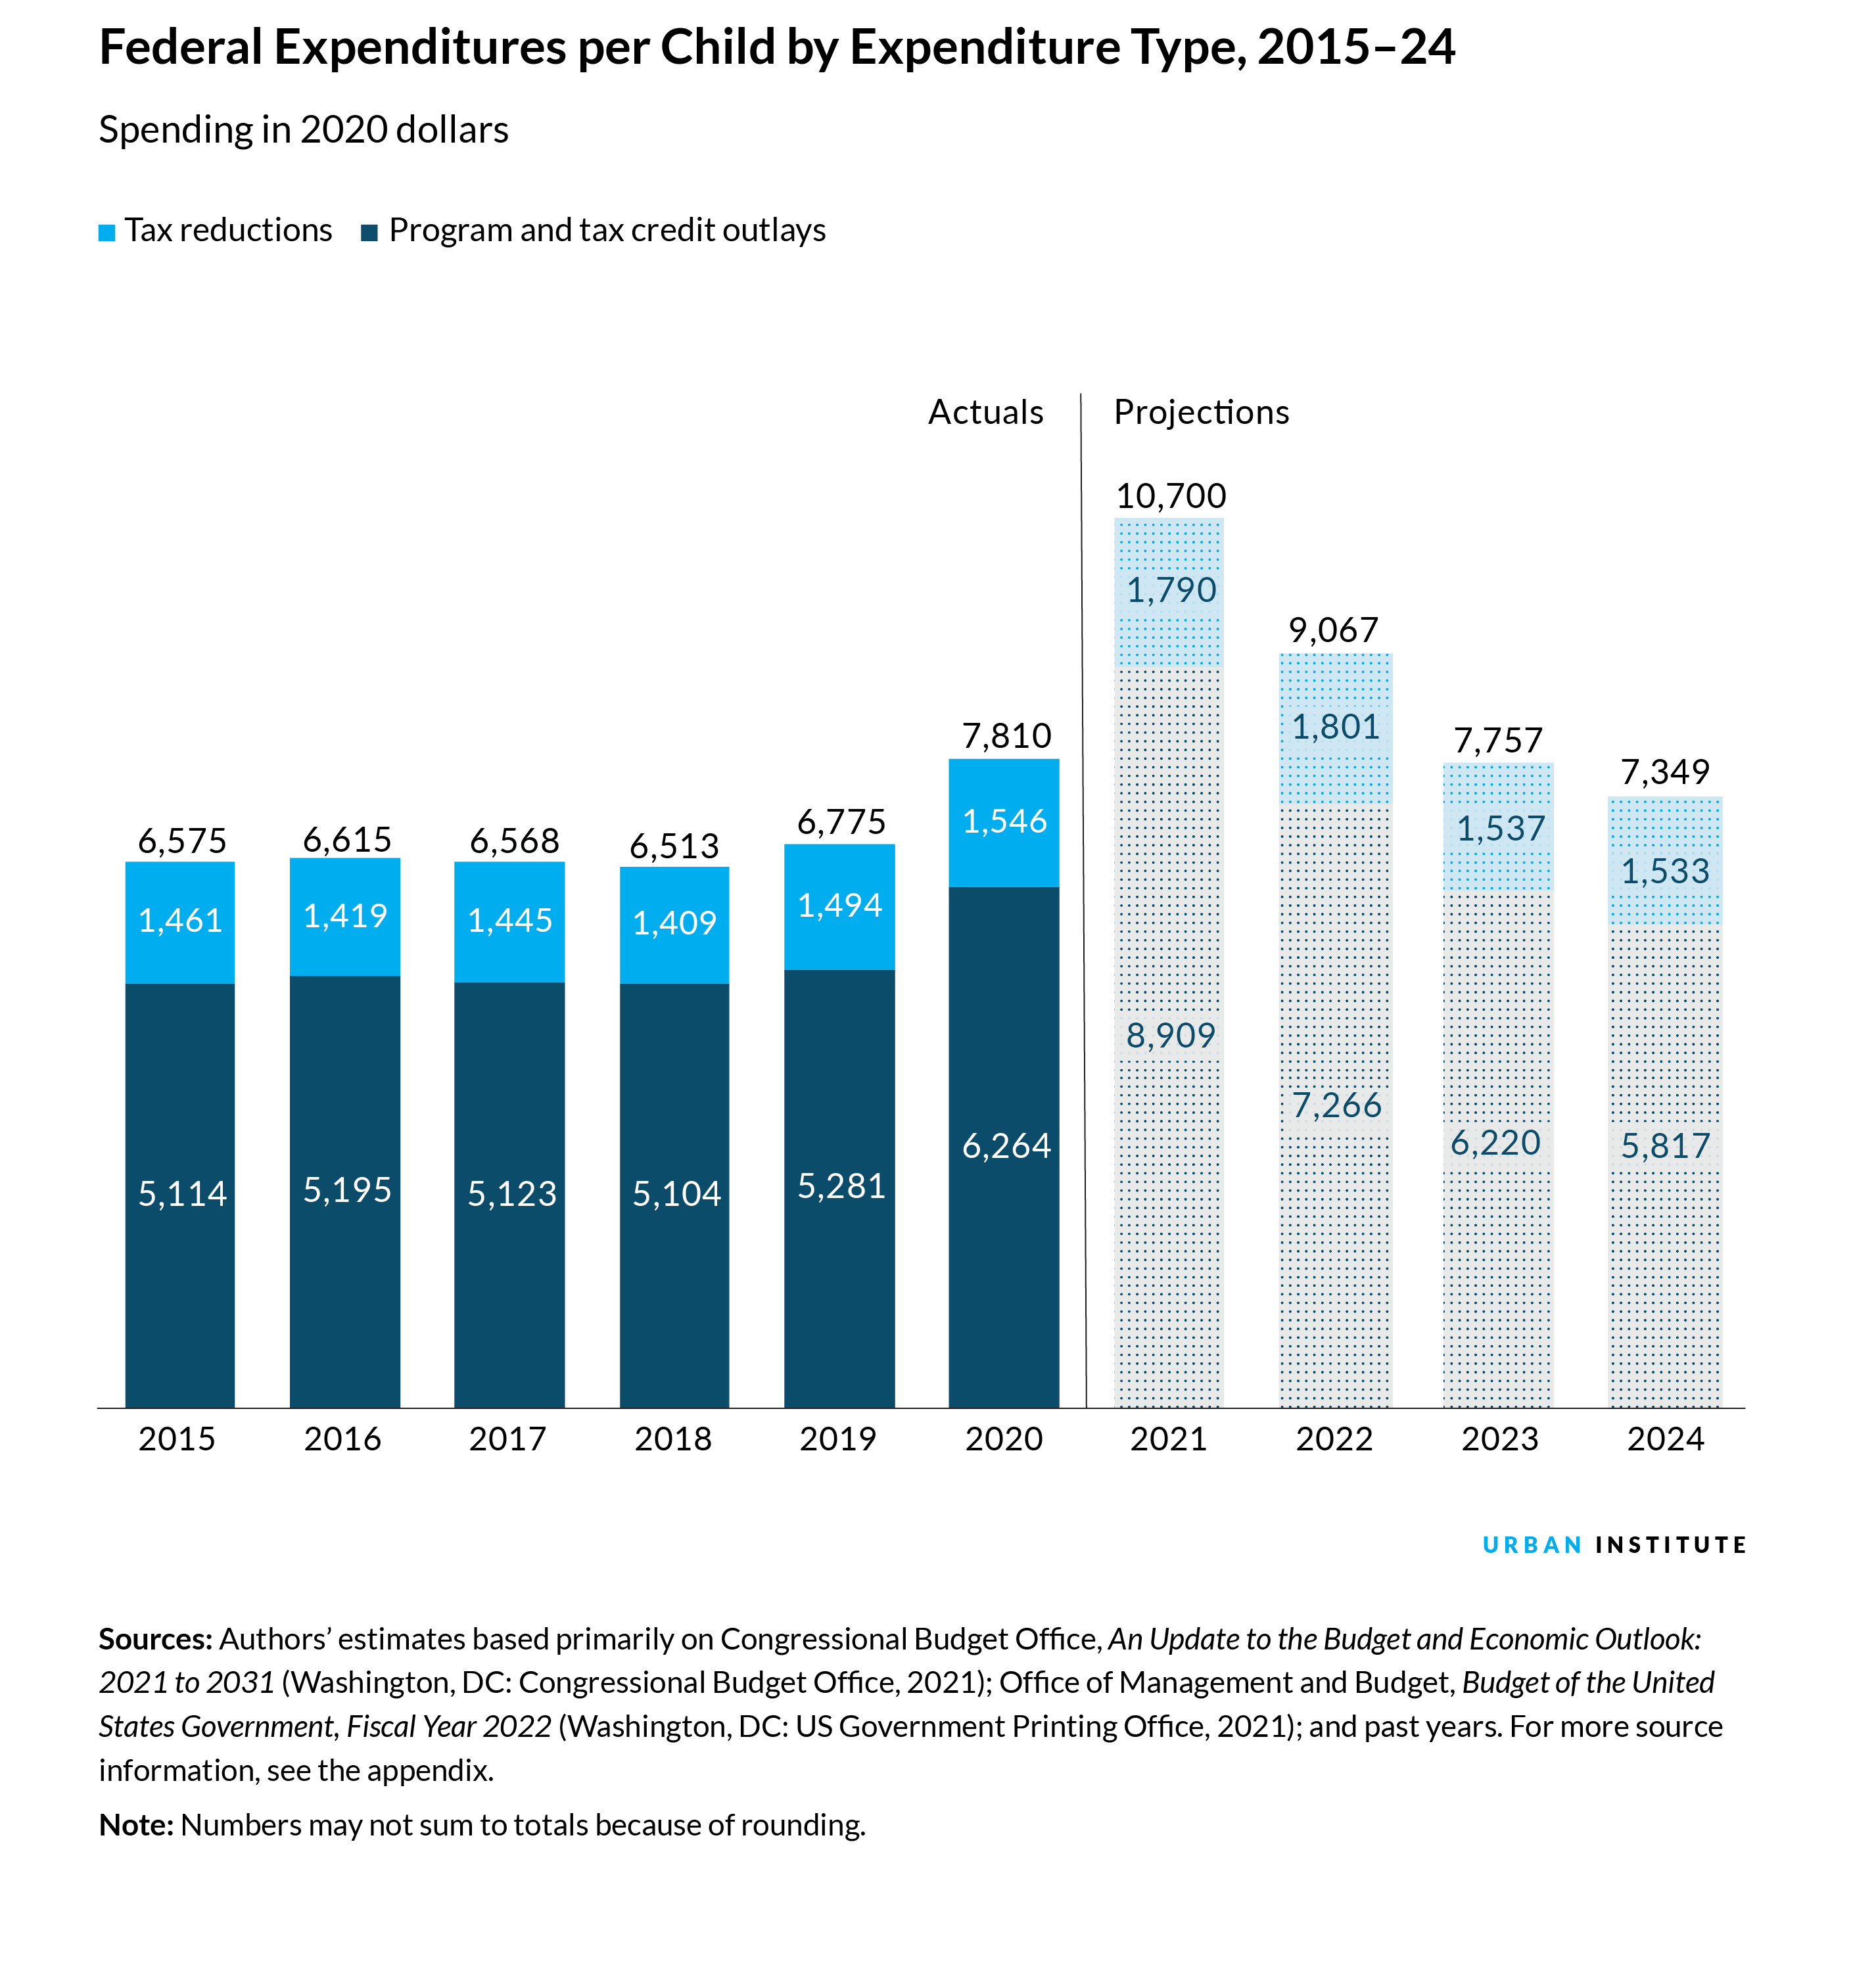
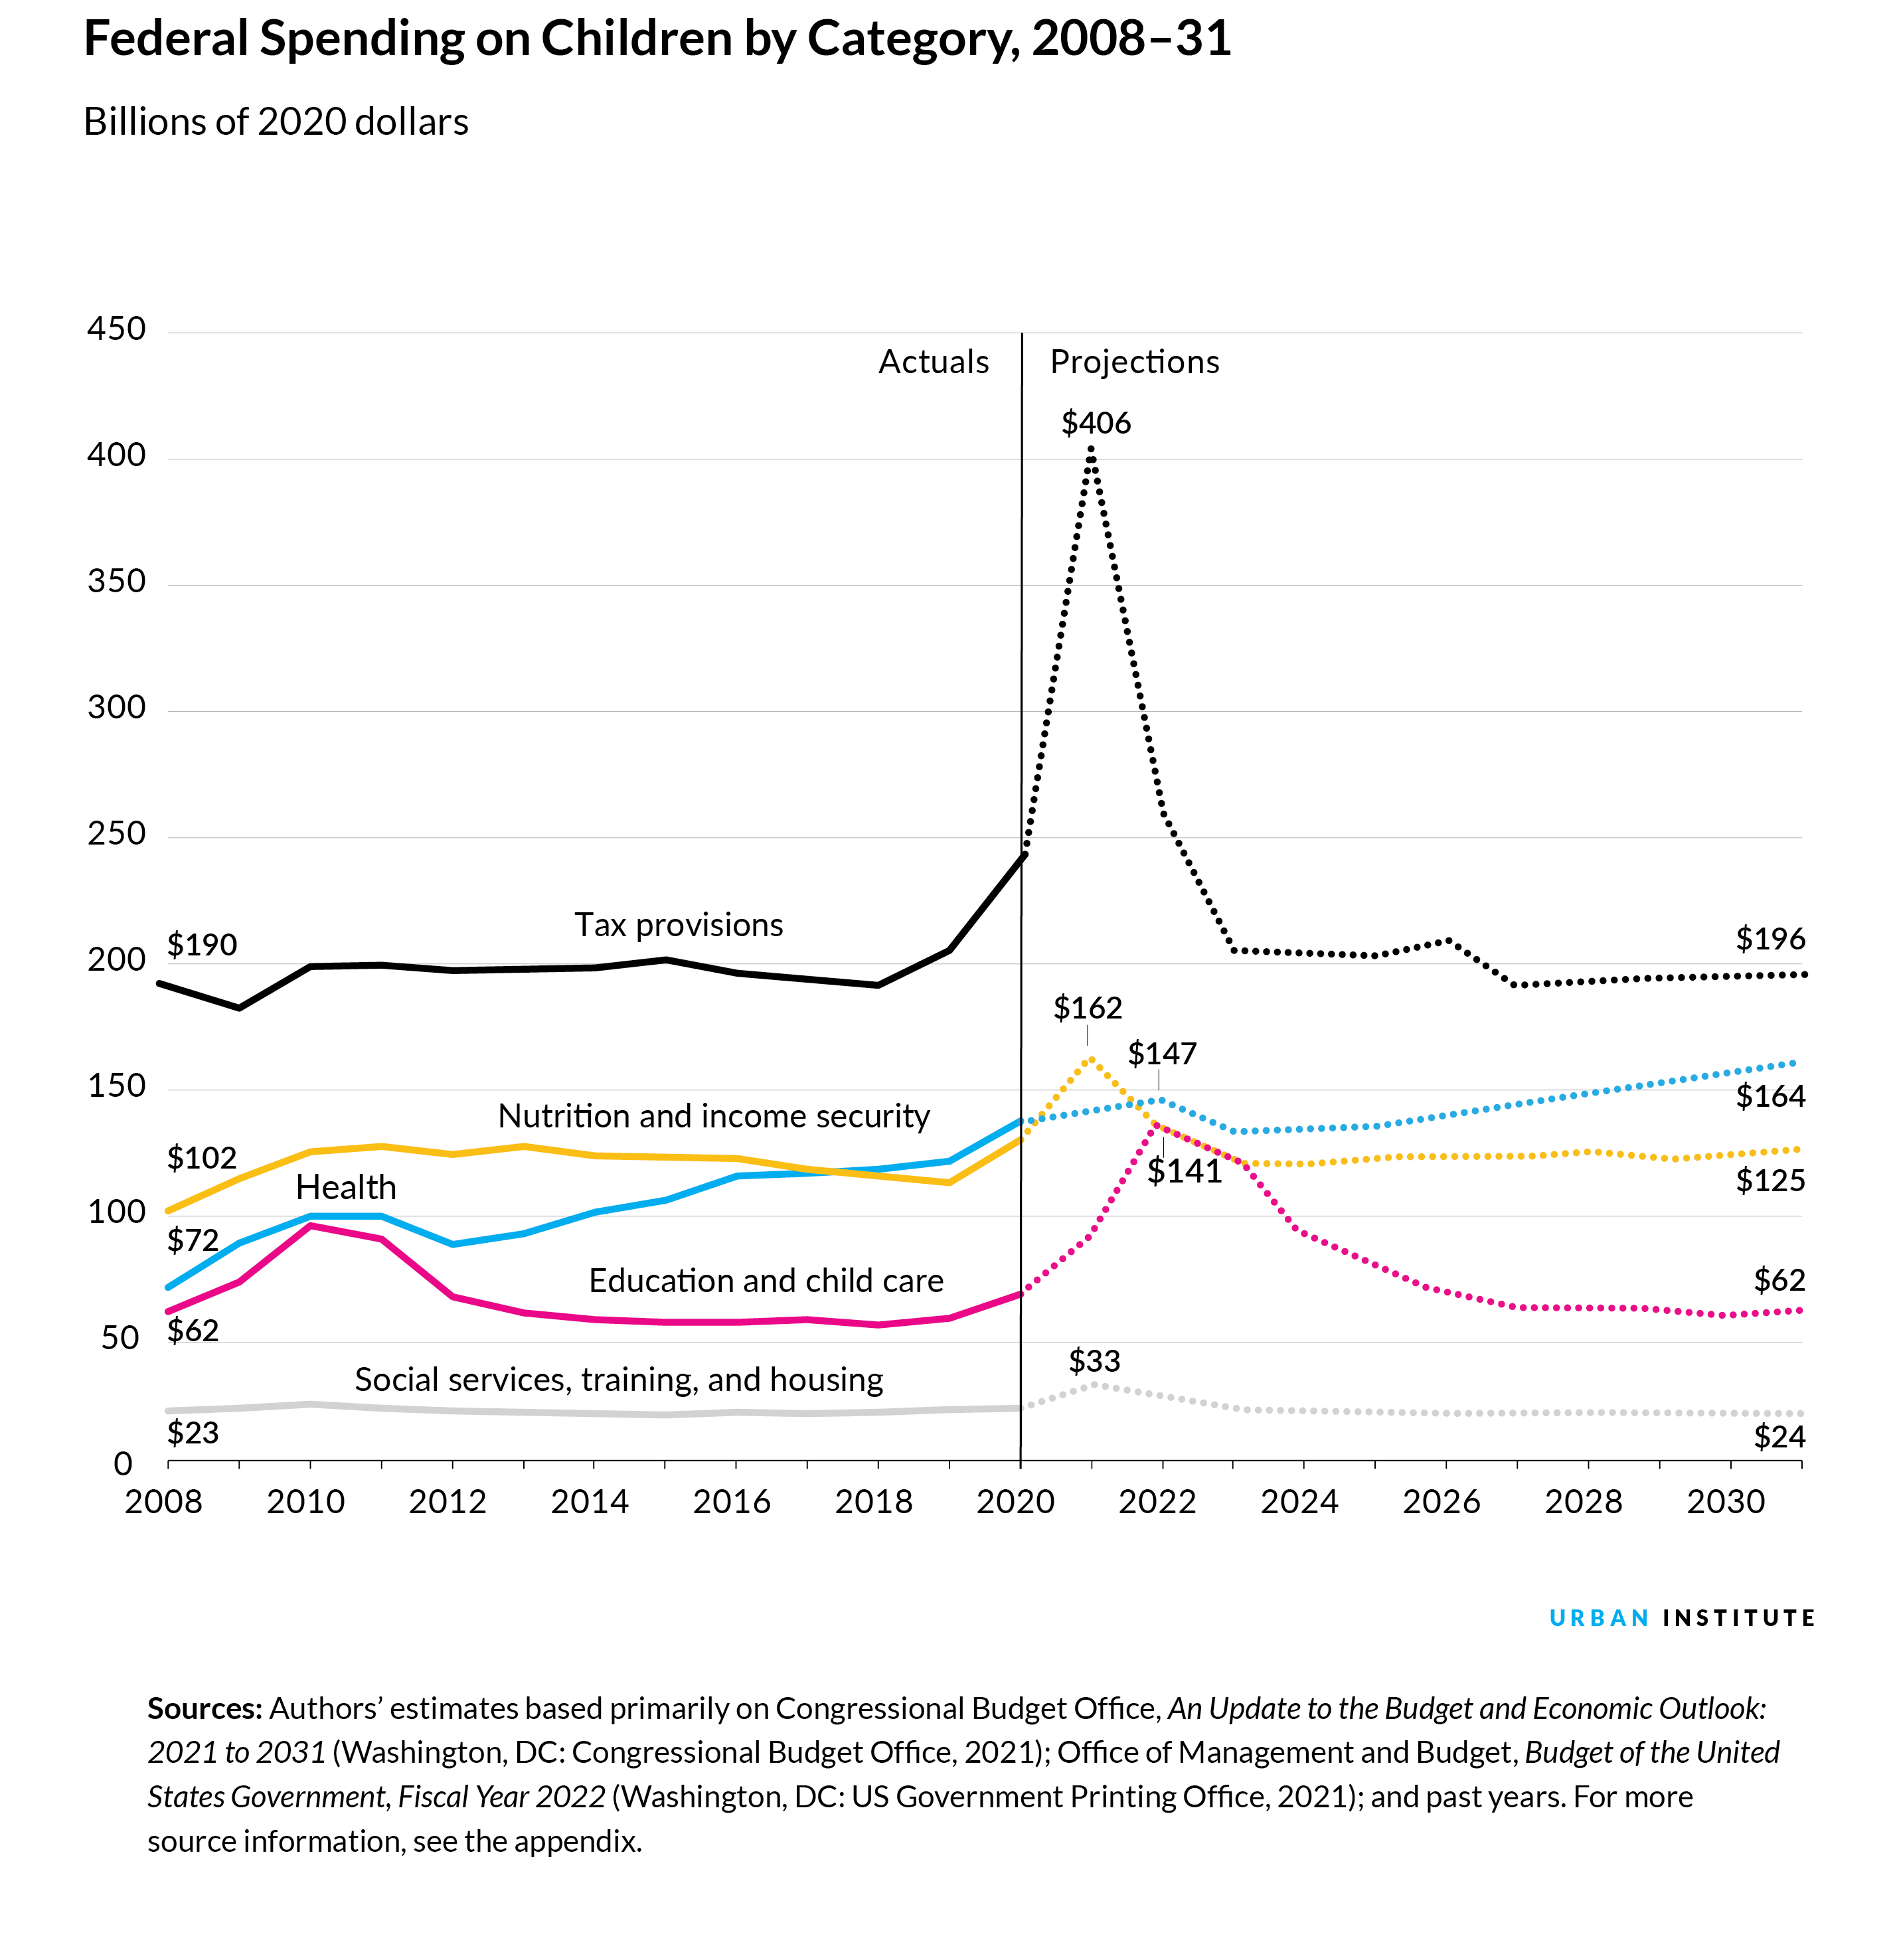
1. Federal spending on children, like all federal spending, spiked during the pandemic
Pandemic relief bills funded programs and tax credits for the nation’s 77 million children and their families. Though federal expenditures on children grew less than spending on adults, federal expenditures on children younger than age 19 increased by 15 percent, or nearly $77 billion, between 2019 and 2020. And Urban Institute researchers predict an even steeper increase of $237 billion between 2020 and 2021.
In 2020, federal expenditures totaled $7,810 per child. These expenditures included $6,264 in outlays—direct spending from federal programs and the portions of refundable tax credits that exceed tax liability and are paid out to families. The expenditures also included $1,546 in tax reductions, which decrease families’ tax liabilities through tax exclusions, deductions, and credits.
Overall, the federal government spent about $1,000 more per child in 2020 than in 2019, reaching a total of $7,810 per child. Assistance for children is expected to climb even higher in 2021, hitting an all-time peak of $10,700 per child.
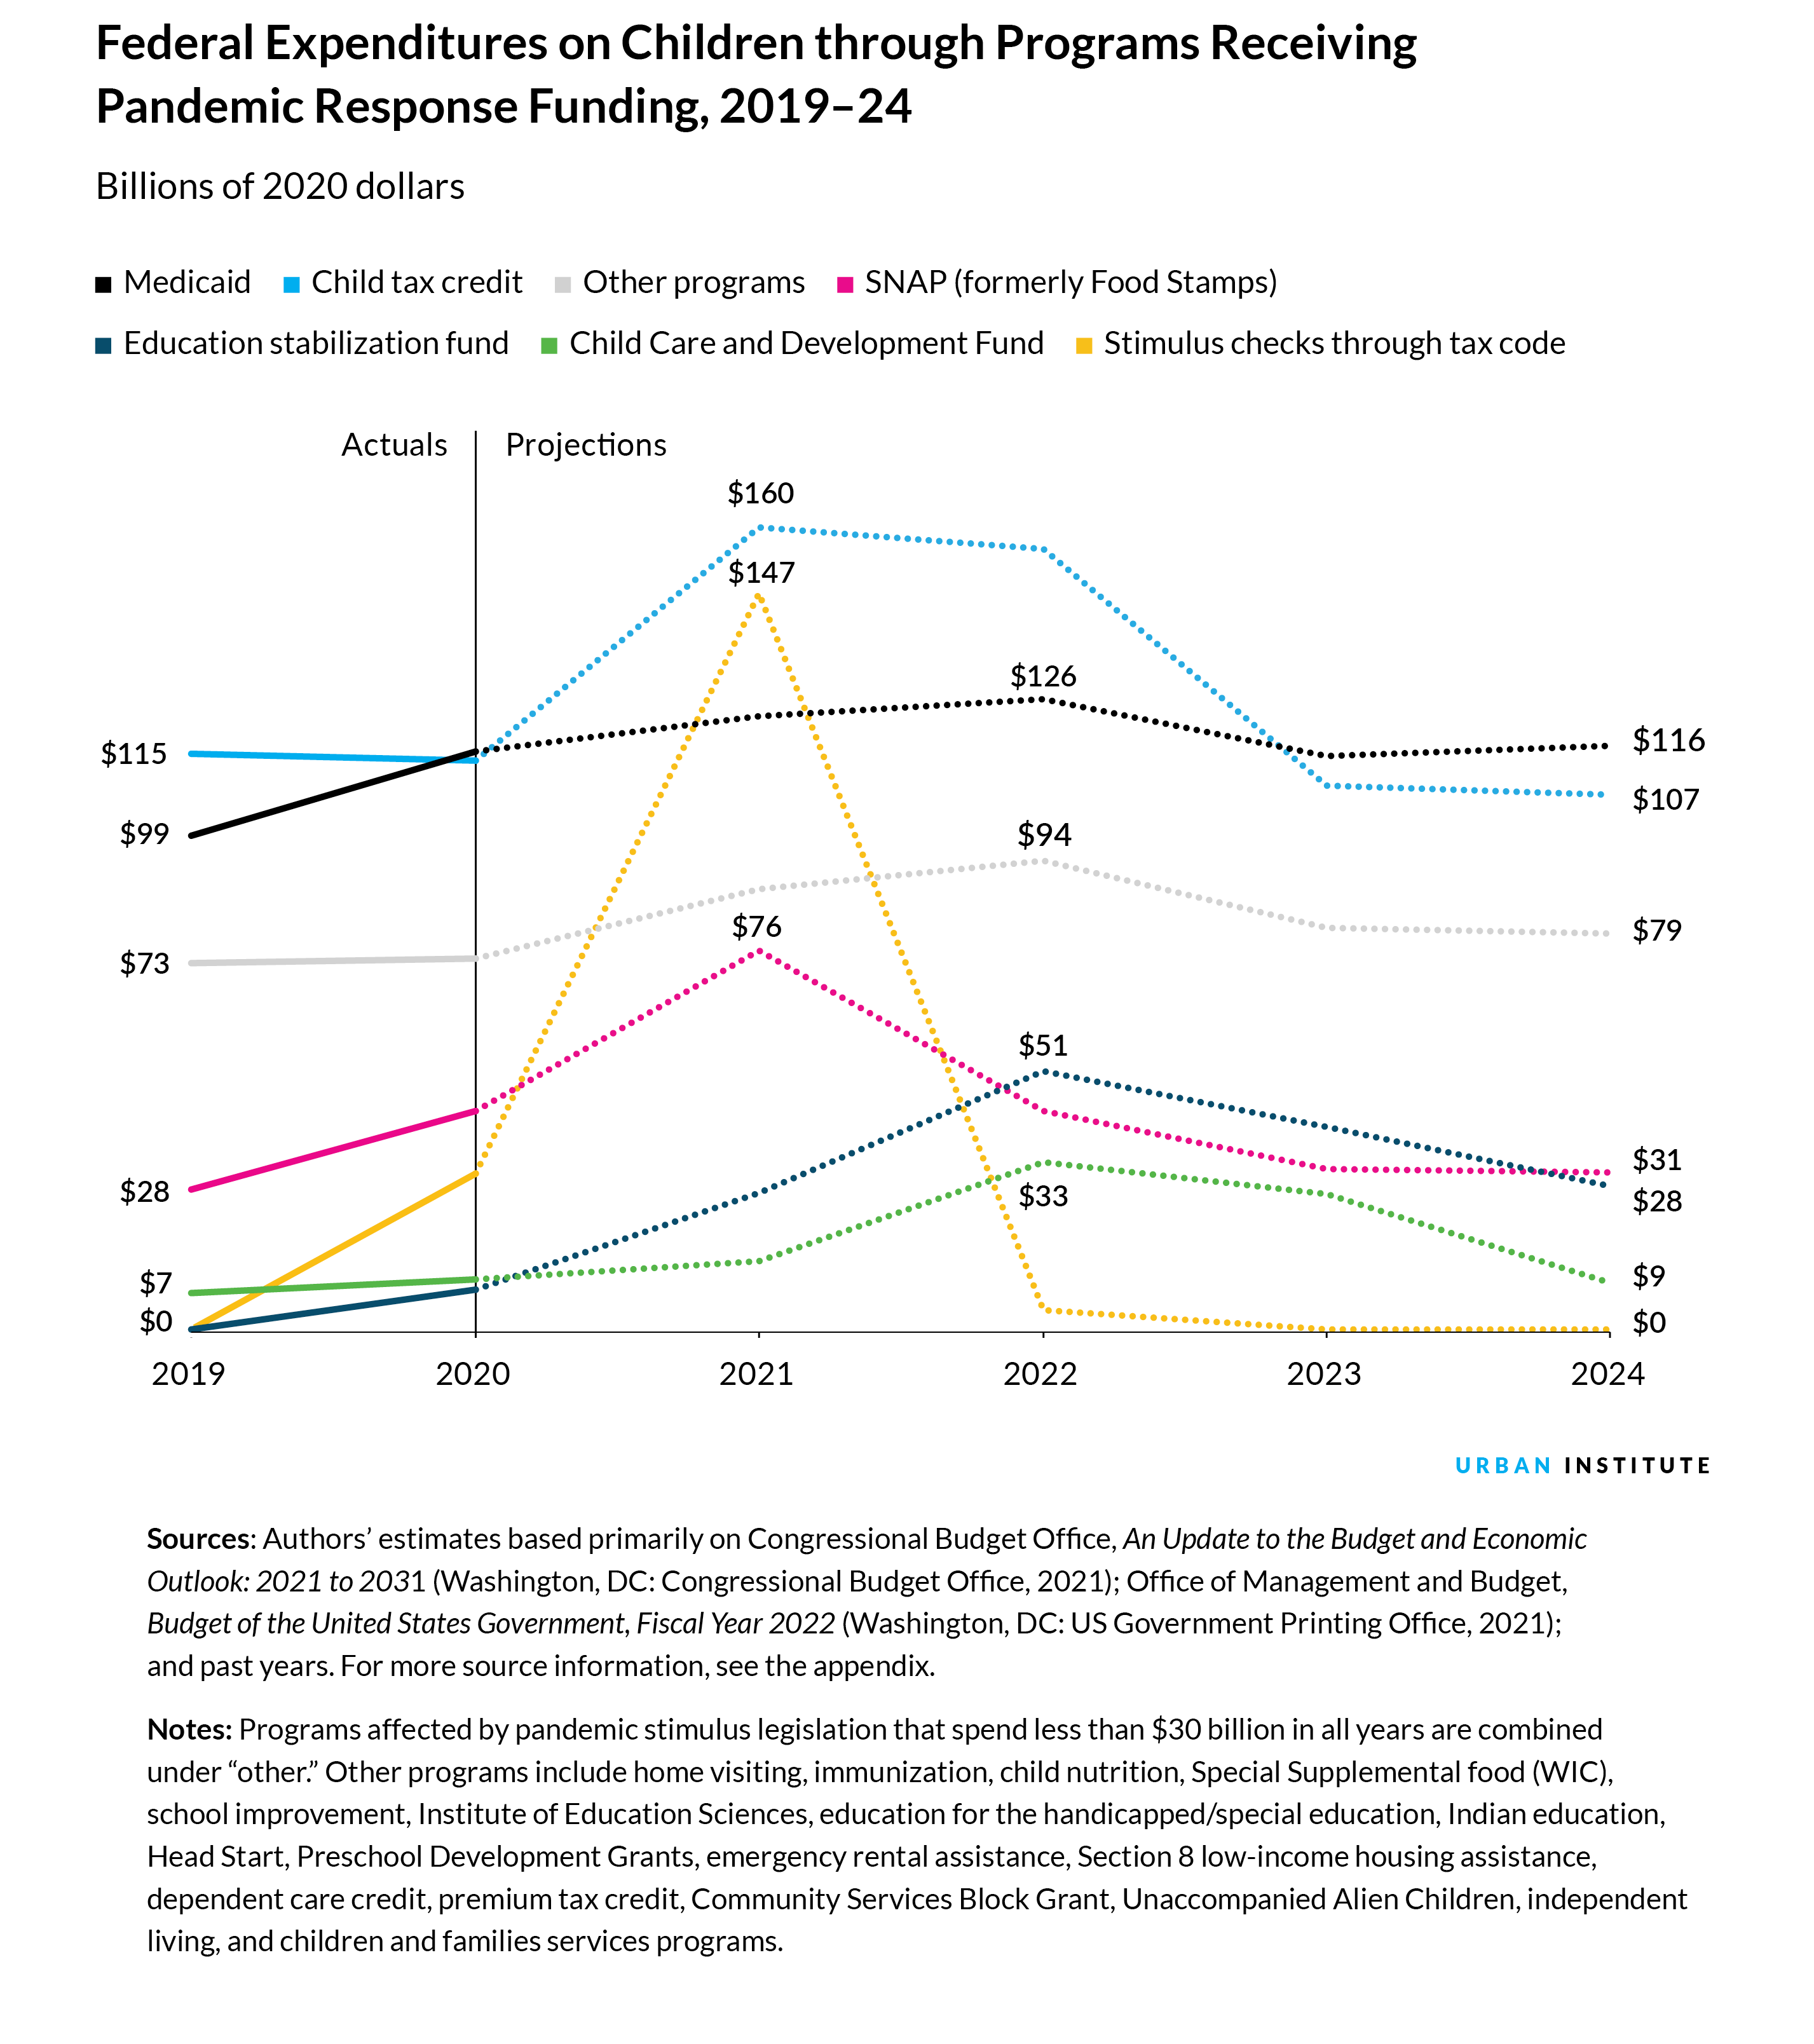
2. Tax provisions have been the most significant spending increases benefiting children during the pandemic
The biggest increases in spending on children have been through tax provisions that provide financial assistance to their families. These expenditures totaled $239 billion in 2020, or 40 percent of the total spent on children.
The $113 billion child tax credit was the largest child-related tax provision in 2020 and is projected to increase to $160 billion in 2021. It was followed by the earned income tax credit, which provided $51 billion to families with children in 2020. And the child benefit portion of the pandemic-response stimulus checks administered through the tax code, which did not exist before 2020, provided $31 billion to families with children in 2020 and is projected to increase by almost five-fold in 2021 to $147 billion.
COVID-19 relief also included more funding for Medicaid, nutrition assistance, child care, and an education stabilization fund. Dozens of other children’s programs and tax credits received smaller increases.
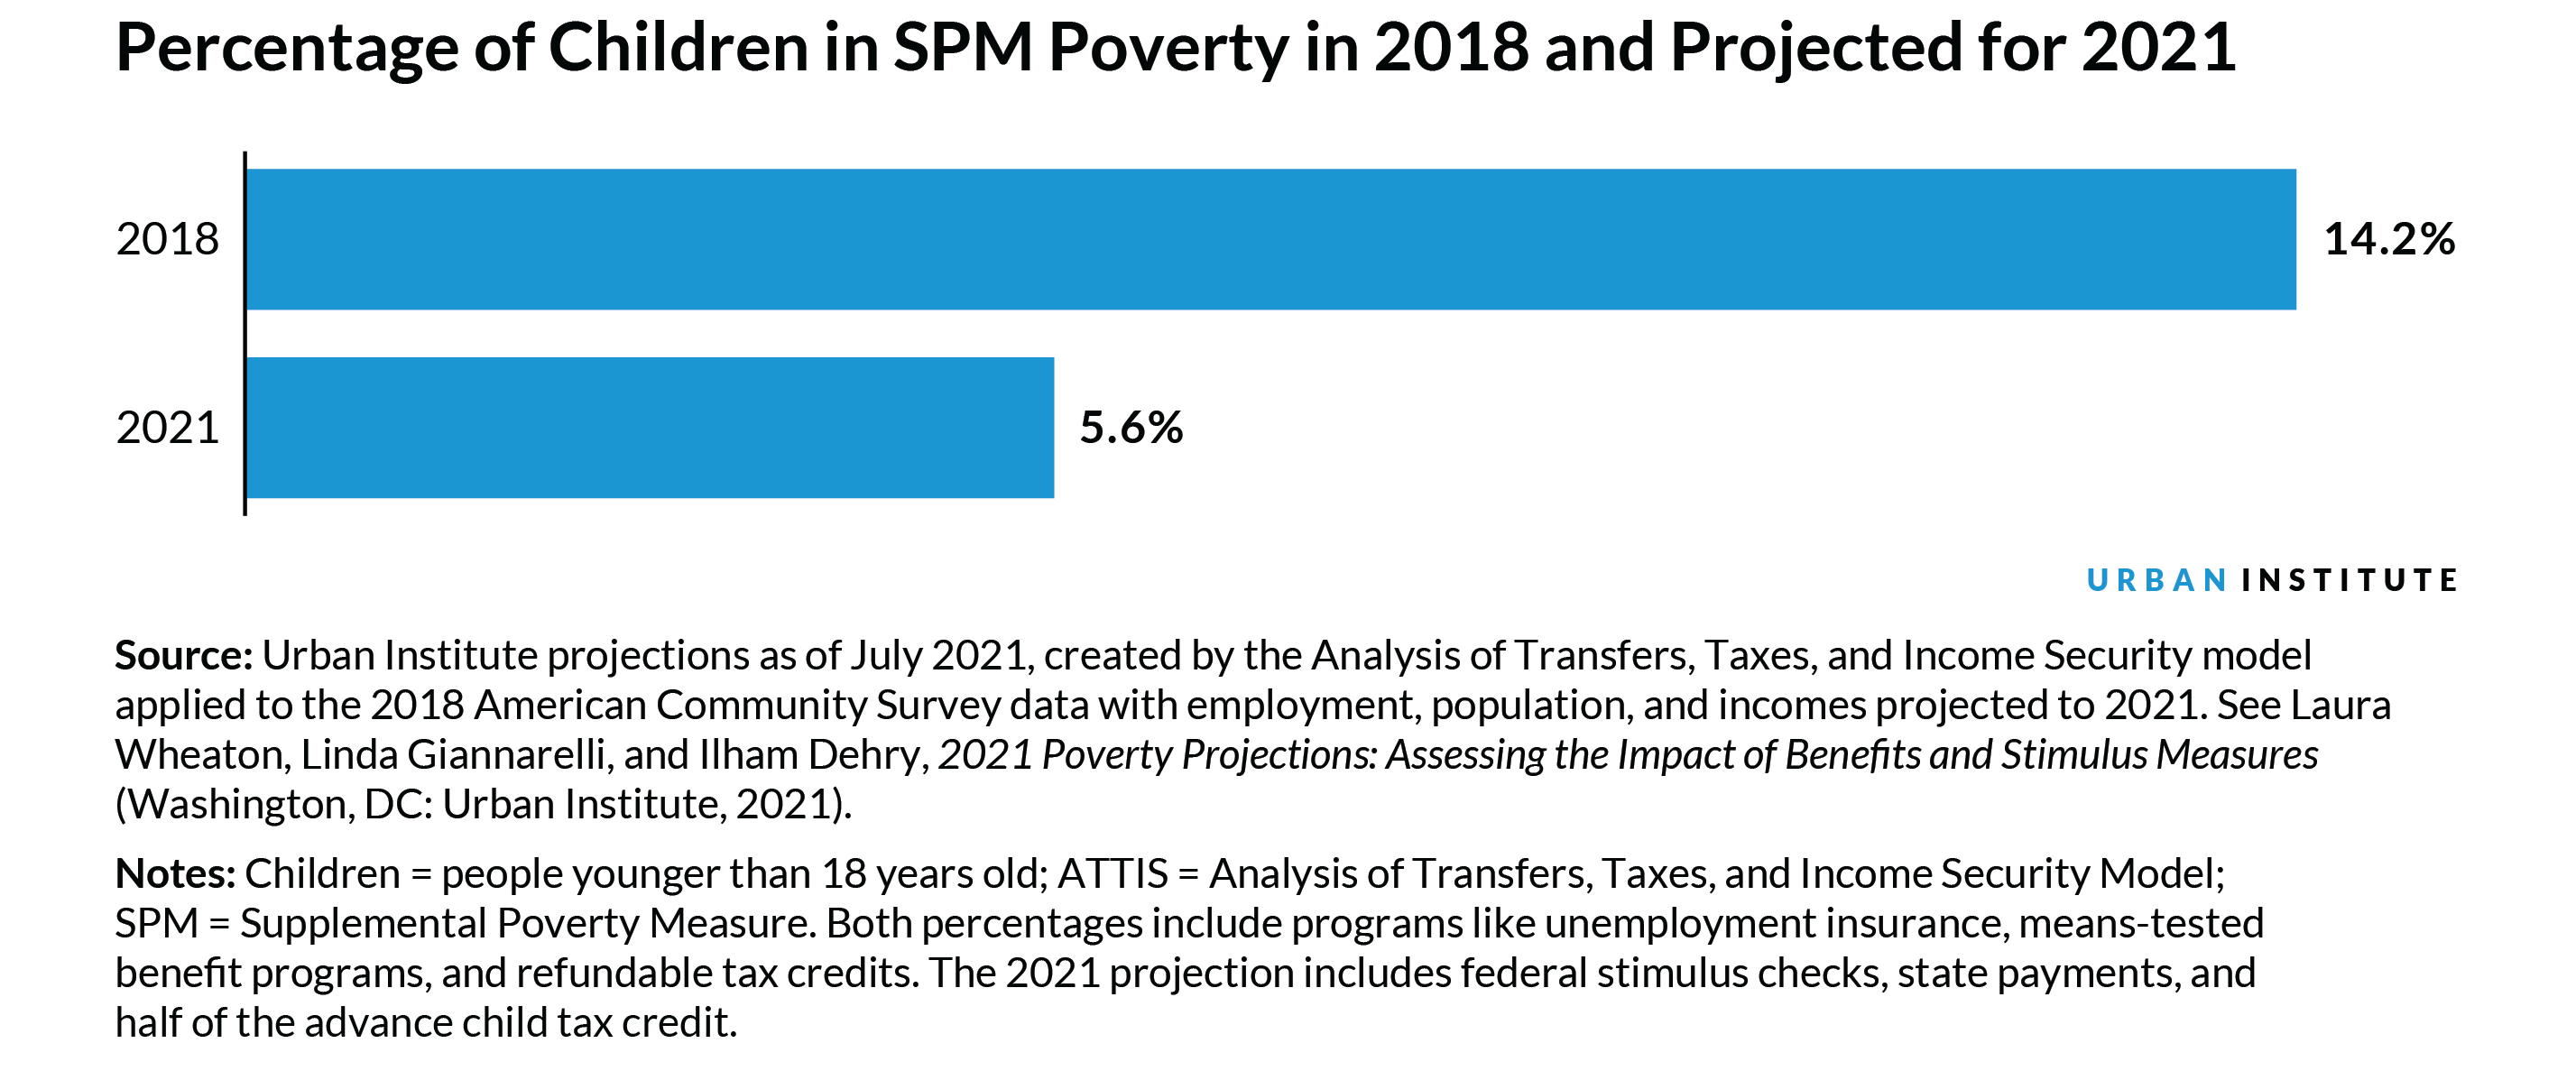
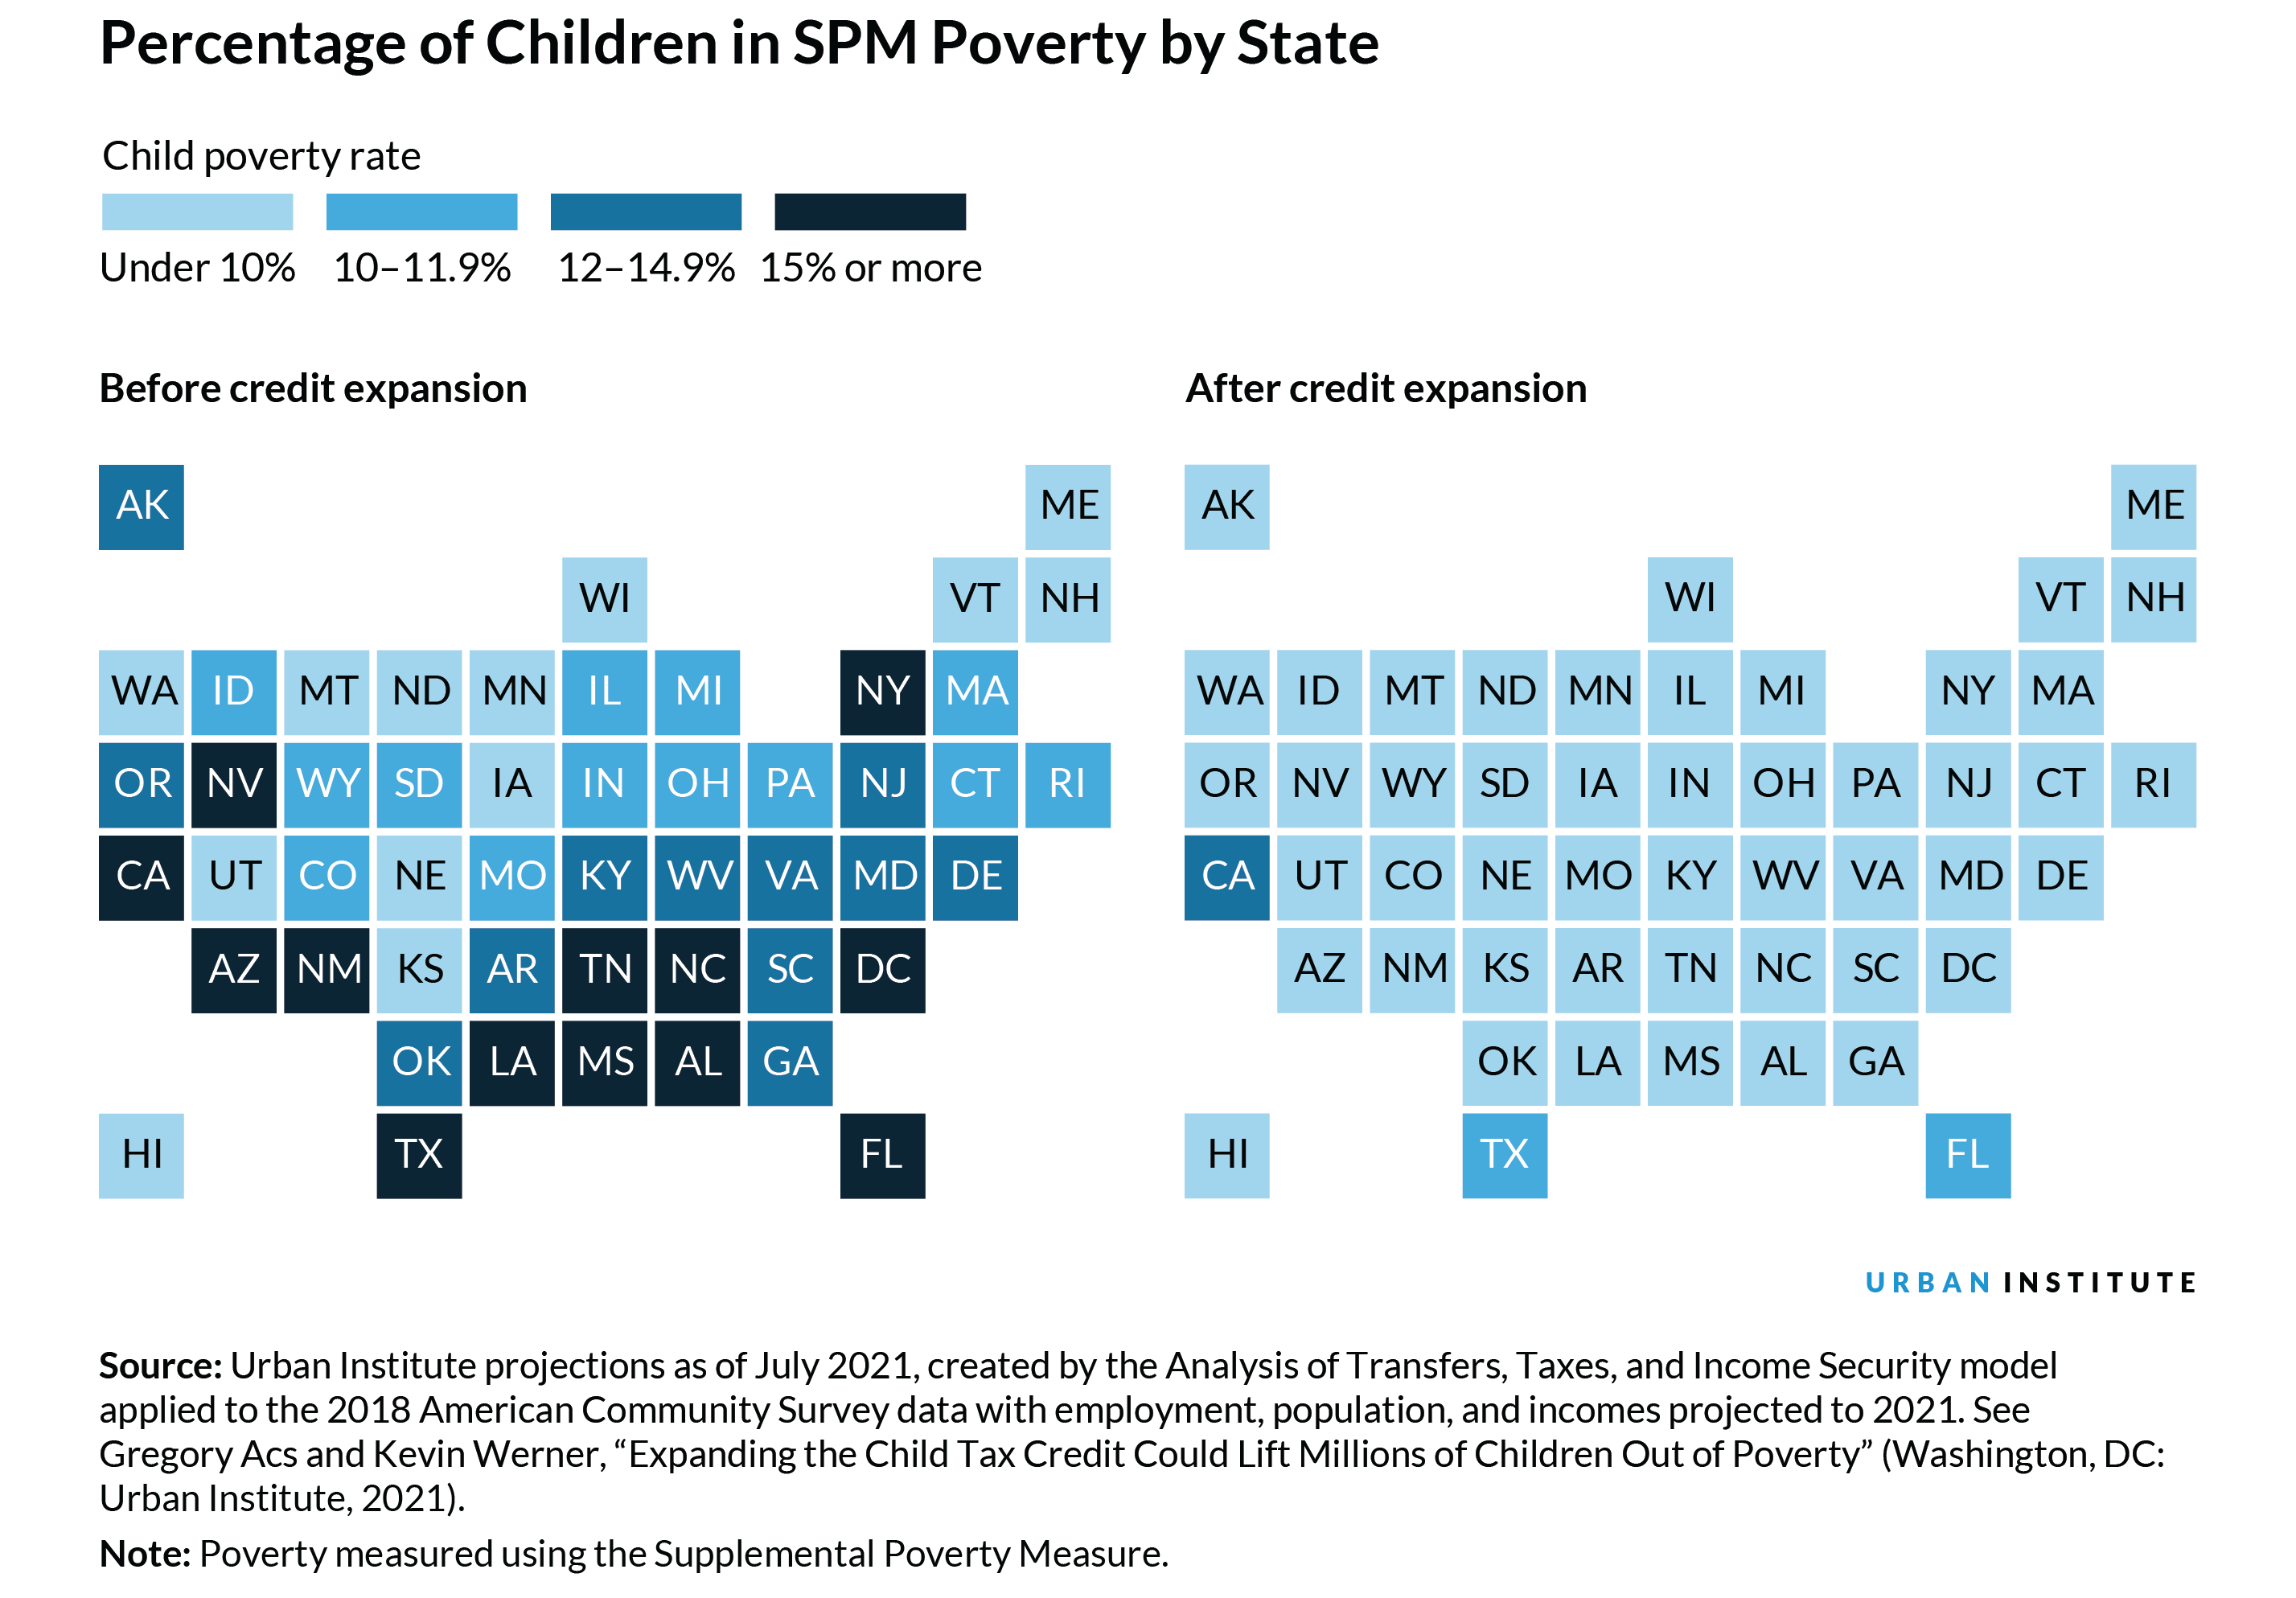
3. Pandemic spending improved kids’ well-being
The federal response to the pandemic reduced hardship for children, lifting millions of kids out of poverty and helping their families put food on the table.
In 2018, the child poverty rate was 14.2 percent, using the supplemental poverty measure that considers a broader range of costs and public benefits. Urban researchers project the child poverty rate will be less than half that amount (5.6 percent) in 2021 with the inclusion of the expanded child tax credit, additional stimulus checks, and other pandemic-response provisions from the American Rescue Plan and earlier legislation. Without any safety net provisions or pandemic-related response, Urban researchers project the child poverty rate would be 30.1 percent in 2021.
And increased spending on SNAP and school meals helped more families with children become food secure. According to an Urban analysis, food insecurity rates for parents living with kids declined between 2020 and 2021, from nearly 1 in 4 parents living with kids to about 1 in 6.
4. Spending on kids is expected to fall back to prepandemic levels by 2024
Spending on pandemic relief is still climbing in 2021, but most of the increases are temporary. Under the policies in place as of May 2021, federal spending on tax outlays, tax reductions, and most programs for kids are projected to decline to prepandemic levels by 2024.
Tax expenditures and outlays for refundable tax credits that benefit children are expected to increase dramatically in 2021 but fall sharply in 2022 and 2023 as temporary provisions wind down. This spending is projected to drop even further later in the decade because the temporary provisions in tax legislation enacted in 2017 will expire.
Federal funding for many programs serving children, including nutrition, education, and child care, is also projected to spike in 2021 or 2022 and then decline. The only expenditure projected to rise consistently over the coming decade is health spending for children (primarily Medicaid and CHIP), consistent with health spending trends overall.
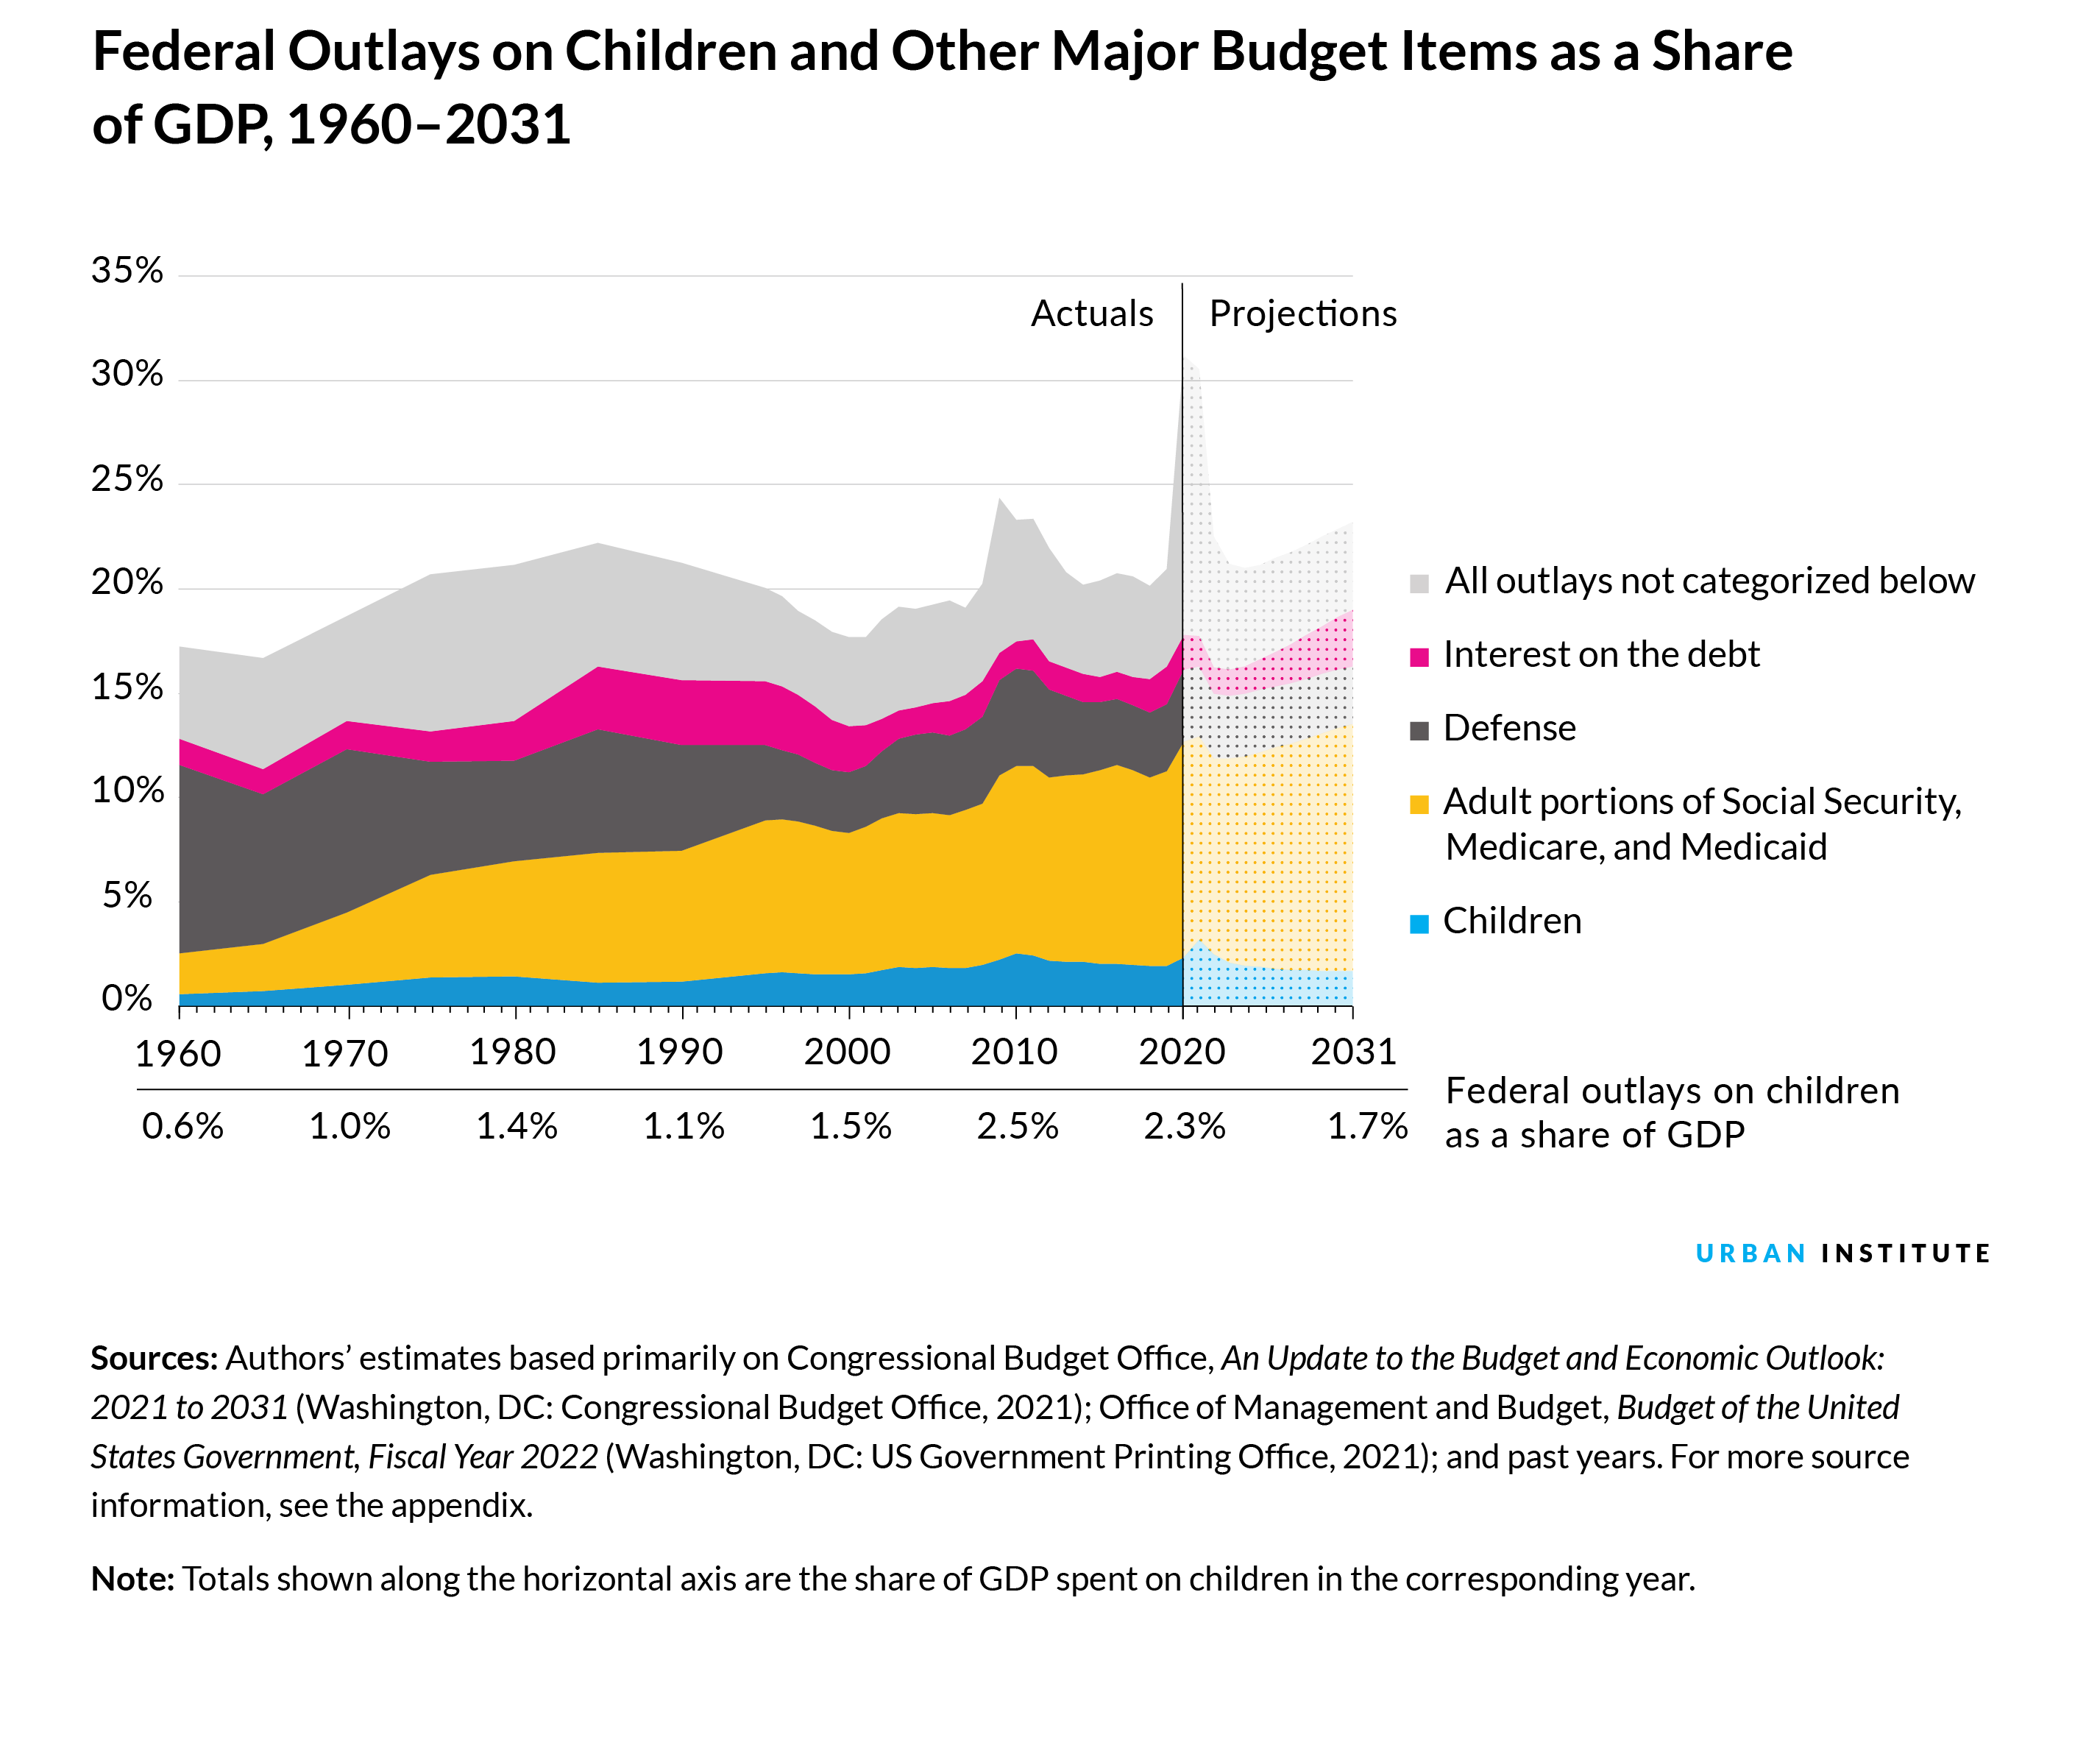
5. Kids’ spending grew less than other spending during the pandemic
Federal spending on children grew less than spending on adults and other priorities. While federal spending on children increased modestly from 2 percent to 2.3 percent of Gross Domestic Product (GDP) or as a share of the economy, federal spending overall expanded from 20 percent to 30 percent of GDP. Much of the increased funding was targeted at adults and businesses, paying for pandemic-response efforts such as support for small businesses and airlines, unemployment insurance, and stimulus checks for eligible adults.
Federal spending on kids is expected to reach a new high of 3.2 percent of GDP in 2021. But under spring 2021 policies, it would dip to 1.7 percent by 2031.
6. The federal government can make sustained improvements in children’s lives
The nation made significant progress in alleviating child poverty in 2021—but the changes aren’t permanent. These positive trends will only continue if the nation continues to prioritize them.
If Congress made the expanded child tax credit permanent, it would drastically decrease child poverty nationwide. Keeping the credit would lift 4.3 million children out of poverty in a typical year. Another way to prioritize kids would be expanding early childhood education, which could improve children’s long-term prospectsand workforce participation as adults.
Funding programs, tax outlays, and tax exemptions that benefit kids can uplift tomorrow’s economy. But spending on children continues to represent a relatively small share of total federal spending.
As the pandemic response has shown, the federal government can take concrete steps to improve kids’ lives. The funding choices policymakers make today can ensure all children are set up for a successful future.
ABOUT
About the data
Analyses from this feature are from the Kids’ Share annual report, which provides a comprehensive picture of federal, state, and local expenditures, and other Urban Institute research linked to in each section. It also shows long-term trends in federal spending, including historical spending since 1960 and projected spending 10 years following the year of each report (to 2031 in this case), assuming no changes to current law except that pandemic-response emergency funding will not continue in future years. Projections for 2021 are based on current law as of May 2021. For more details, please see the Data Appendix to Kids’ Share 2021.
PROJECT CREDITS
This feature was funded by the Annie E. Casey Foundation and the Peter G. Peterson Foundation. We are grateful to them and to all our funders, who make it possible for Urban to advance its mission. The views expressed are those of the authors and should not be attributed to the Urban Institute, its trustees, or its funders. Funders do not determine research findings or the insights and recommendations of our experts.
RESEARCH Heather Hahn, Cary Lou, Julia Isaacs, Eleanor Lauderback, and Hannah Daly
DESIGN Brittney Spinner
EDITING Liza Hagerman
WRITING Laura Swanson