The housing bust, and the stunted recovery that followed, were back-to-back blows to many African American and Hispanic communities, where more households entered the market just before the crash, only to be locked out once prices began to bounce back. We visualized this story by mapping over 100 million mortgages from 2001 to 2013 and found that it held true in virtually every part of the country.
Housing prices have improved since the recession, but the number of mortgages taken out to purchase a home is still far below where it was at the peak of the market: 2.7 million in 2013, compared to 6.2 million in 2005. The decline is much sharper for African American and Hispanic borrowers (73 percent) than for white borrowers (48.2 percent). Credit availability is a big part of the story. In 2005, lending standards were extraordinarily relaxed, with lenders issuing mortgages to many households that would not typically be considered creditworthy. Today, the opposite is true; standards have tightened considerably, and the shift has disproportionately affected African American and Hispanic households, which tend to have lower credit profiles.
United States
Loans to African-Americans and Hispanics 2005-2013: -73.0 percent
Loans to non-Hispanic whites: -48.2 percent
Difference: 24.8 percent
Still, some metropolitan areas’ recoveries stood out as extraordinarily uneven, with mortgages for white and Asian borrowers experiencing far smaller declines than for African American and Hispanic borrowers. Here, we rank the top 5 least equitable recoveries.
Number five: Detroit-Warren-Dearborn, MI

Loans to African-Americans and Hispanics 2005-2013: -81.3 percent
Loans to non-Hispanic whites: -46.8 percent
Difference: 34.6 percent
Number four: San Francisco-Oakland-Hayward, CA
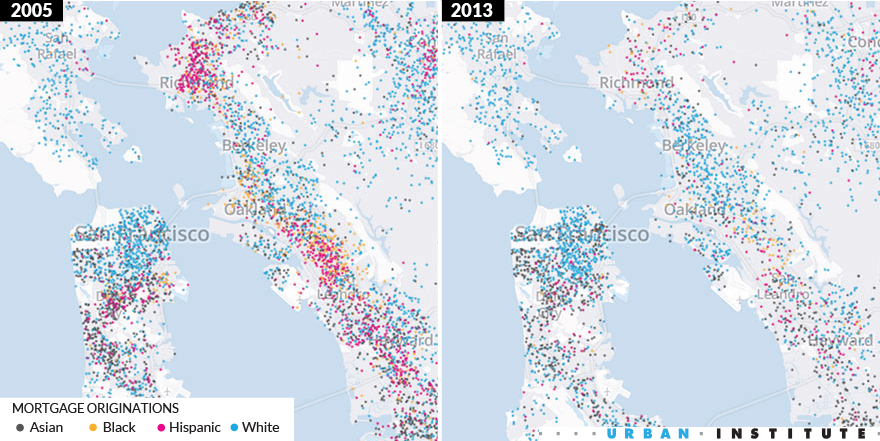
Loans to African-Americans and Hispanics 2005-2013: -84.8 percent
Loans to non-Hispanic whites: -49.8 percent
Difference: 35.0 percent
Number three: San Jose-Sunnyvale-Santa Clara, CA
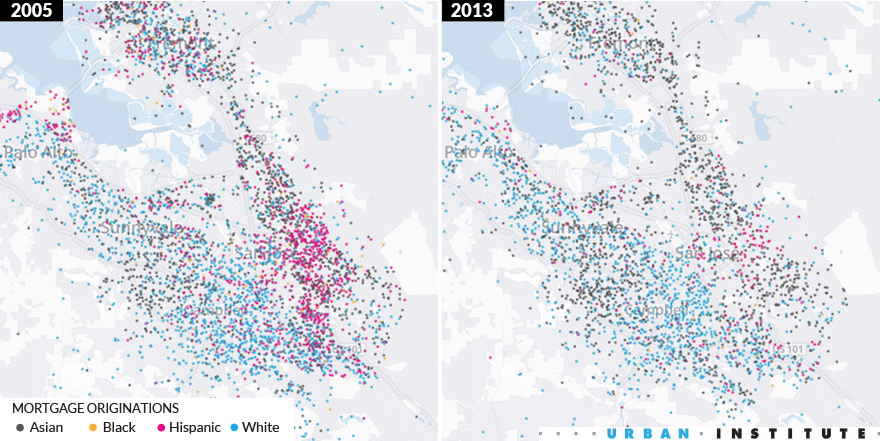
Loans to African-Americans and Hispanics 2005-2013: -88.4 percent
Loans to non-Hispanic whites: -52.6 percent
Difference: 35.8 percent
Number two: Santa Rosa, CA
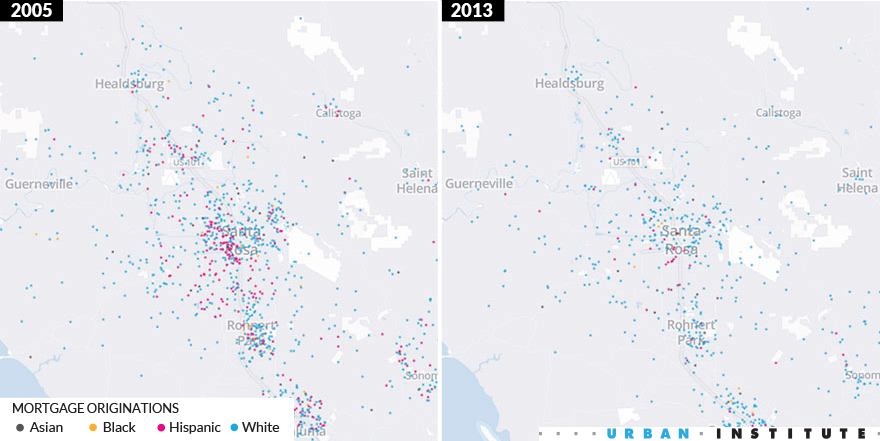
Loans to African-Americans and Hispanics 2005-2013: -87.1 percent
Loans to non-Hispanic whites: -47.9 percent
Difference: 39.3 percent
Number one: Grand Rapids-Wyoming, MI
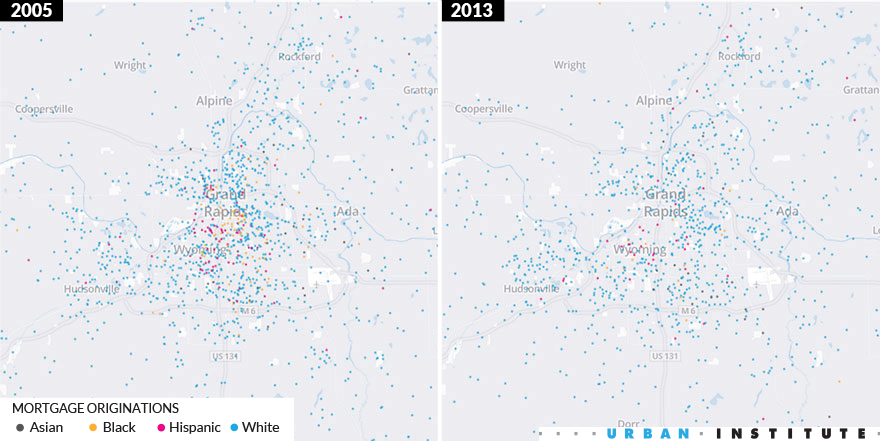
Loans to African-Americans and Hispanics 2005-2013: -65.9 percent
Loans to non-Hispanic whites: -21.4 percent
Difference: 44.5 percent
Tune in and subscribe today.
The Urban Institute podcast, Evidence in Action, inspires changemakers to lead with evidence and act with equity. Cohosted by Urban President Sarah Rosen Wartell and Executive Vice President Kimberlyn Leary, every episode features in-depth discussions with experts and leaders on topics ranging from how to advance equity, to designing innovative solutions that achieve community impact, to what it means to practice evidence-based leadership.