
For more than three decades, researchers and policymakers have used the mortgage denial rate as a measure of general mortgage credit availability and of racial and ethnic disparities in access. But the traditional way of calculating the denial rate doesn’t distinguish between two very different sources of change in access to mortgage credit: the mix of mortgage applicants and the denial decisions of mortgage lenders.
We have developed an alternative and improved measure we call the “real denial rate” or RDR that addresses this problem by calculating the denial rate for applicants with less than “near perfect” credit. This measure of credit availability consistently reflects mortgage market trends and reveals three important facts about the mortgage market: That we’ve been underestimating rates; that gaps in denial rates between whites and minorities have narrowed for those with less than perfect credit; and that it’s always been easier to qualify for an FHA loan than a conventional loan.
The traditional measure of mortgage denial rates is a flawed measure of credit availability.
Traditionally, we have measured the mortgage denial rate by dividing the number of denied mortgages by the total number of mortgage applications, which we call the “observed denial rate” or “ODR.” For example, if 100 people apply for a mortgage and 30 are denied, the mortgage denial rate is 30 percent using the traditional method (30/100). But what if 40 of the applicants had near perfect credit (which we define as applicants that apply for a non-risky loan and have a FICO score greater than 700, a loan-to-value ratio less than 78 percent, and a debt-to-income ratio less than 30 percent) and therefore almost no chance of being denied a mortgage? If we remove them from the calculation, we get a much better understanding of how tight credit really is.
The denial rate without those with near perfect credit is the RDR. In this example, if 40 applicants had near perfect credit, the RDR would be 50 percent (30/60) - a much higher number. This adjusted rate better tells us how willing lenders are to lend to applicants that pose some risk, and is thus a better measure of the tightness of credit. Note that within the group of less-than-perfect credit applicants, individuals have different credit profiles. This is not controlled for in the RDR calculation.
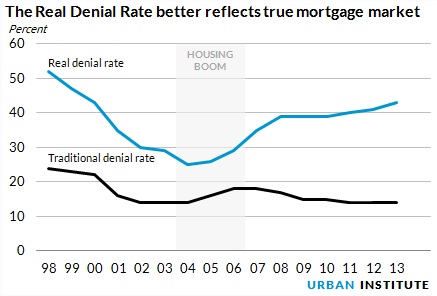
Because it conflates those with near perfect credit with those who might actually be denied a mortgage, the traditional method fails to accurately reflect mortgage market trends. In the figure to the right, the ODR rose during the boom, peaked at 18 percent in 2006, and then dropped as the bottom fell out of the market in 2008. Since 2011, it has remained at the historic low of 14 percent. But this trend obscures the fact that the share of less-than-perfectly-qualified applicants rose during the boom years and fell during the crash.
The RDR, on the other hand, reflects that denial rates for applicants with less-than-perfect credit have risen substantially, from 25 percent in 2004 to 43 percent in 2013. Of course, the terms of many loans made in 2004 were not favorable to borrowers. In contrast to the new HFPC Credit Availability Index, RDR does not distinguish between risky and less risky loan products.
Our new measure of credit availability reveals three key points
- We’ve been significantly underestimating the mortgage denial rate. Applicants with less than perfect credit faced a 43 percent denial rate in 2013– more than three times higher than the 14 percent estimated by the traditional calculation.
-
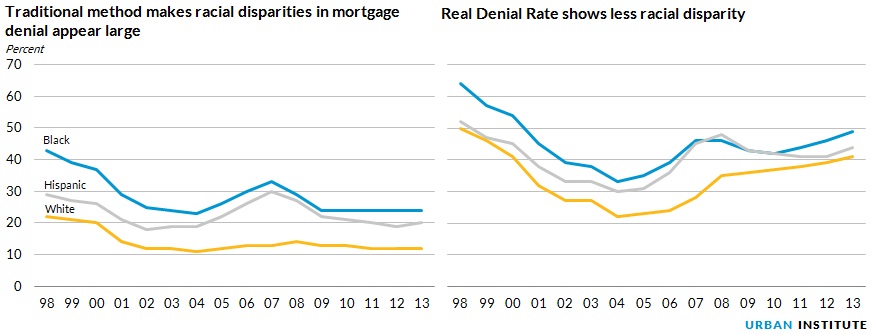
For applicants with less than perfect credit, the gap in denial rates between whites and minorities has narrowed. The traditional denial rate calculation shows that blacks and Hispanics are denied mortgages at significantly higher rates than whites. This calculation does not account, however, for the differences in the share of low-credit applicants across racial groups. The RDR accounts for these differences and shows a narrower—and declining—gap between whites and minorities. (We have omitted Asians from this post; the group is smaller and more heterogeneous than the other groups. We cover Asians in related papers.)
- It’s always been easier to qualify for an FHA loan than a conventional loan, even post-crisis. Using the traditional denial measure, it looks like post-crisis consumers are more often denied FHA loans than conventional loans. But the RDR reveals that this difference is all about the applicant pool and that FHA is still the channel by which lower-credit profile applicants are most likely to get mortgage loans.
The RDR replaces an important but flawed measure used for decades with a more accurate and robust method of calculating the mortgage application denial rate, allowing the housing finance industry, policymakers and other stakeholders to gain deeper insights on trends in credit availability and fair lending.
Tune in and subscribe today.
The Urban Institute podcast, Evidence in Action, inspires changemakers to lead with evidence and act with equity. Cohosted by Urban President Sarah Rosen Wartell and Executive Vice President Kimberlyn Leary, every episode features in-depth discussions with experts and leaders on topics ranging from how to advance equity, to designing innovative solutions that achieve community impact, to what it means to practice evidence-based leadership.