
We did a double take when a presenter at a recent conference declared that the mortgage default rate is 6.5 percent. We had just declared in our monthly Chartbook that the rate is 12.2 percent. Neither of us had our numbers wrong—but how?
“Default” has multiple meanings and measures different things, so it’s important to carefully read the small print to know what any purported default number represents. Understanding default rates is critical to our ability to understand mortgage market health, so it’s important to clear up the confusion. Therefore, we offer three questions you need to ask about any default number.
1. Which definition of default are you using?
Each mortgage loan has specific payment terms, usually a requirement that a certain amount be paid on a certain date each month. Borrowers are also usually granted a grace period (15 days is common) before a lender starts charging interest on a late payment. A loan is delinquent if a payment is between 30 and 90 days late (as measured from the original payment date). Once a payment is later than that, the concept of default begins, and confusion sets in.
Several terms are used during this period, all of which are sometimes also called a default:
- Seriously Delinquent: A loan that is more than 90 days late.
- Ever-90: A loan that has been 90 days late at least once, but may be current now.
- A credit event: A loan that has been 180 days late at least once (“ever-180”) or was liquidated prior to becoming 180 days delinquent. This is the definition used in the GSE risk-sharing deals.
- Liquidation. At some point, a severely delinquent loan will be liquidated through foreclosure or a non-foreclosure termination such as a short sale or a deed-in-lieu. The GSEs also include the sale of delinquent notes in these numbers.
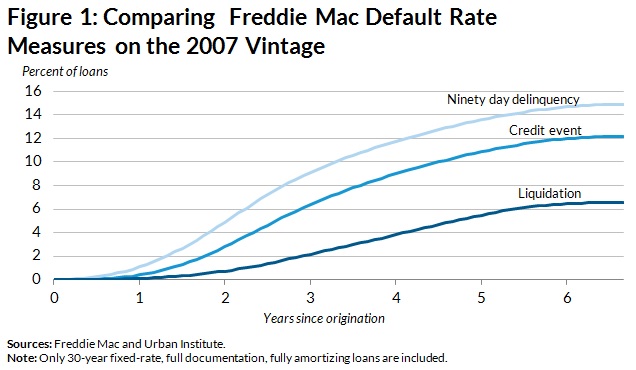
Figure 1 plots three of these concepts (ever-90, credit event and liquidation) making it clear that they are not the same. To date, of Freddie Mac’s full-documentation, fully amortizing, 30-year fixed-rate loans originated in 2007, 14.9 percent were ever-90, 12.2 percent experienced a credit event, and 6.5 percent were liquidated. Most of the loans that have experienced a credit event, and remain delinquent are likely to liquidate eventually, although they have not done so.
2. Which group of loans are you analyzing?
Regardless of which definition one uses for a default, it’s also important to understand which group of loans is being evaluated. Sometimes we look at a group of loans originated in a common year, referred to as a “loan vintage.” Vintage default charts relate to static pools of loans: once a loan is part of a vintage, it remains part of that vintage, and no new loans enter it once the year is over.
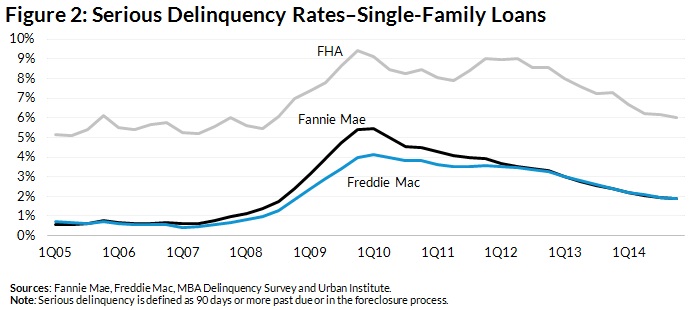
The other common way to look at default considers how a whole portfolio of loans has performed over time—the method reported in our monthly Chartbook. In this measure, the number (or sometimes the dollar amount) of loans that are in default is compared to the total number of loans in a given portfolio. This may be reported as a number at a particular time or as a graph showing trends over time (Figure 2).
Frequently, this total portfolio default statistic is used to compare the performance of different types of loans. For example, as the housing crisis was heating up, it was common to see default rate comparisons of prime, sub-prime and FHA loans. In contrast to the vintage measure, the loans included in this measure are dynamic: loans that have been prepaid or liquidated will drop out, and new loans will be added. Even when using the same vintage or portfolio, we sometimes consider a subset of loans in that group (e.g., Fannie, Freddie, GSE, FHA, all mortgages).
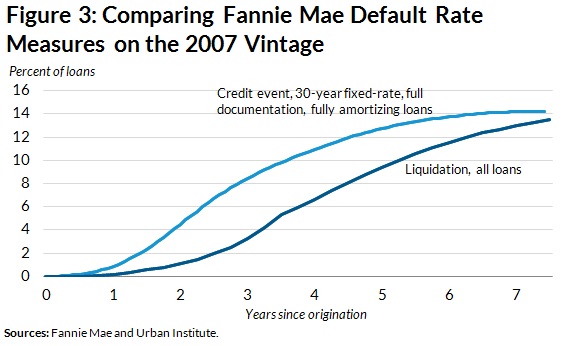
Figure 3 illustrates how different default definitions and different groups of loans can create confusion, using Fannie Mae’s 2007 vintage as an example. The line with the higher default rate is based on Fannie Mae’s 2007 vintage full documentation, fully amortizing 30-year book of business, and defines default as a credit event, while the line with the lower default rate is based on all 2007 Fannie originations, and defines default as a liquidation event. While a quick look at the figure might make it appear that the 2007 full documentation, fully amortizing book of business has performed worse than the entire book of business, the full documentation book of business was actually much stronger.* Because loans that experience a credit event often get back on track and because in certain states, a loan can take several years to liquidate, likely only slightly more than half of the loans that experience a credit event have actually been liquidated.
3. Over what period of time are you evaluating defaults?
Defaults can be measured over the life of the loan for a loan vintage or at a point in time for a given loan portfolio.
When examining a specific loan vintage, we generally ask if the loan has ever been in default, even if it has later cured. Thus, a statement that a certain percent of the 2007 vintage went into default, but a different percent of the more pristine 2012 loans went into default, considers the default to date over the life of the loan. In general, more recent vintages will have lower default rates, simply because they have not had as long an opportunity to default.
Point-in-time portfolio default rates ask whether a loan is currently in default, which excludes loans that cured after they became more than 90-days delinquent. While this measure is useful in determining a portfolio’s current health, especially in the post-2008 period, its accuracy has been confounded by modification issues. If a loan goes into default, but is then modified and becomes current under the modified terms, it is considered current. Only if the borrower becomes more than 90 days late under the new terms will the loan be considered in default under this measure—and then, just to make things more complex, the loan is regarded as “redefaulted.”
If you want to compare apples to apples, you have to know three things about any given default rate: Which definition of default you’re using, which group of loans you’re analyzing and over what period of time are you measuring the defaults.
*An earlier version of this sentence omitted the word "documentation".
Tune in and subscribe today.
The Urban Institute podcast, Evidence in Action, inspires changemakers to lead with evidence and act with equity. Cohosted by Urban President Sarah Rosen Wartell and Executive Vice President Kimberlyn Leary, every episode features in-depth discussions with experts and leaders on topics ranging from how to advance equity, to designing innovative solutions that achieve community impact, to what it means to practice evidence-based leadership.