
With less than a week until the midterm elections, all eyes are once again on the nation’s red-and-blue electoral map. Besides who they vote for, do residents of red and blue states differ in how they give?
In early October, the Chronicle of Philanthropy published “How America Gives,” a look at the giving rate in American states and cities. One of the most striking tables in this impressive series of articles is “How States Compare and How They Voted in the 2012 Election.” The Chronicle used data from the IRS’s SOI Tax Stats, but all giving-rate statistics used in this analysis are available from NCCS.
The table ranks the states, plus DC, by the percentage of adjusted gross income (AGI) donated to charity by taxpayers who itemize on their IRS tax returns. The top-ranked states on the Chronicle’s list look much like the map you’d see on TV during election night: a vast sea of red with isolated pockets of blue. Fully 18 of the top 20 most charitable states cast their electoral votes for Mitt Romney. The District of Columbia actually ranks 20th; although not a state, DC is “bluer” by far than any other state. Wyoming, which is on the short list of “reddest” states, ranks 21st.
Most of the top 20 states are not what people consider “swing states,” either; only North Carolina, Florida, and Indiana have ever gone for Barack Obama. So does this demonstrate that people in red states are more charitably inclined than their blue-state counterparts? Not necessarily, as a a closer look at the question shows.
If you look at giving rates calculated across the entire red-state and blue-state populations, the difference looks smaller: taxpayers in red states who itemize give 3.7 percent of their AGI to charity, compared with 2.7 percent in blue states.
- The percentage of itemizers who claim deductions from charitable contributions is actually a little higher in blue states (82.1 percent) than in red states (81.3 percent).
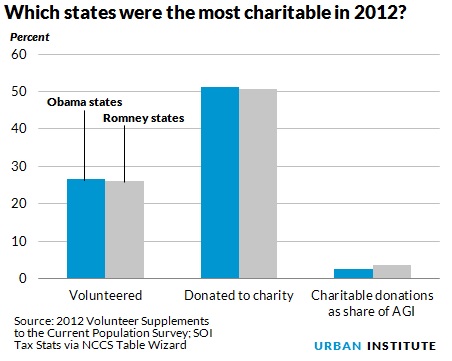
- If instead we consider the percentage of all adults who donate $25 or more to charity—whether or not they itemize on their tax returns—the difference again favors the blue states (51.2 percent) over the red states (50.6 percent).
If we shift gears and look at charitable donations of time rather than money, the red-blue difference nearly disappears:
About 26.6 percent of blue-state residents volunteer, compared with 26.1 percent of red-state residents.
- The red states (34.8 hours per resident) and blue states (34.9 hours) contributed almost the same amount of volunteer hours per capita. However, red states actually enjoy a slight advantage in hours served per volunteer: 133.3 hours compared with 130.7 hours for blue-state residents.
- Residents of blue states and red states are also about equally likely to work with their neighbors to fix or improve something (8.4 percent to 8.3 percent).
So, while red-state residents do give larger shares of their AGI to charity—and this difference is not driven by population sizes—blue-state residents measure up more favorably in other civic activities.
Tune in and subscribe today.
The Urban Institute podcast, Evidence in Action, inspires changemakers to lead with evidence and act with equity. Cohosted by Urban President Sarah Rosen Wartell and Executive Vice President Kimberlyn Leary, every episode features in-depth discussions with experts and leaders on topics ranging from how to advance equity, to designing innovative solutions that achieve community impact, to what it means to practice evidence-based leadership.